
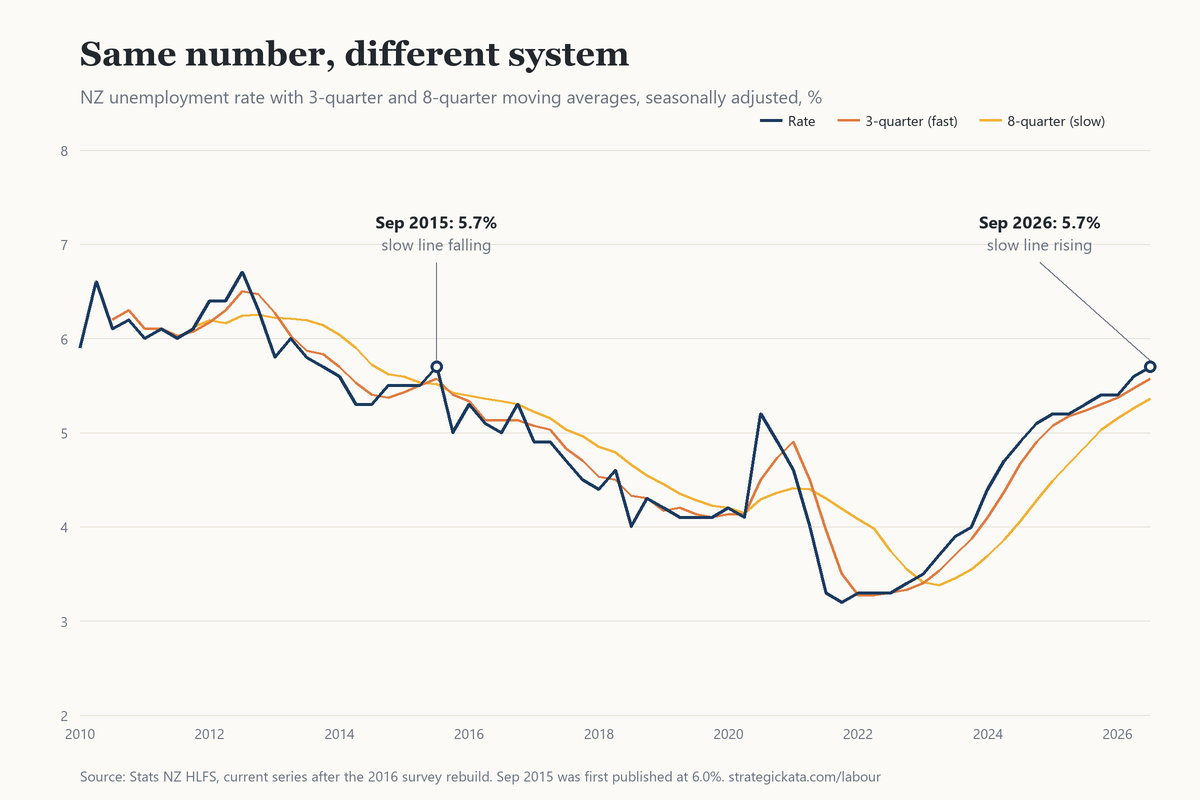
The last time New Zealand’s unemployment rate was 5.7%, I was leaving Inland Revenue for BNZ. That was the September 2015 quarter. Software and IT work was chasing productivity through Agile and lean methods, and I’d spent nearly three years at IRD proving they worked inside a government department. Skills the market needs will get you a job, and those were the skills it wanted, so moving was workable even with unemployment where it was.
On 4 November this year Stats NZ put the rate at 5.7% again. Same number, same quarter, 11 years apart. This time I’m retired, I draw on savings instead of a salary, and the number reaches me through two dashboards I built to tell me whether anything should change in how I manage my money.
When the June quarter printed 5.6% in August, half the commentary had the comparison ready within the hour: the highest since September 2015. It’s a good sentence. It’s accurate, and it fits a headline. What the comparison left out was what came after September 2015. The rate kept falling for the next two years and was down to 4.5% by the end of 2017. That recovery travelled with the comparison, unstated, and it did most of the reassuring. I said so on LinkedIn that morning and put a call on the record that the September quarter would go higher. It came in at 5.7%, above every bank’s pick: ANZ and BNZ had 5.6%, Westpac and ASB 5.5%, Kiwibank 5.4%.1
A number is a snapshot
It takes a trend to tell a story, and a single number is one moment of it. The late Hans Rosling is the example I’d follow here: he used data to tell a story, and he made it come alive, so people could see the connection between what was on the screen and what they were seeing and living themselves. Each data point only means something next to the ones before it, and next to whatever produced it.
When a number looks familiar, the recognition itself feels like analysis. We’ve seen 5.7% before, we know how that one ended, and the checking stops there. The ending that followed the familiar number arrives as a free gift, and nobody remembers accepting it.
A journalist on deadline has one line to place a number for a general reader, and “highest since 2015” is the most honest single line available. An economist’s morning note answers the question the client asked. Most of us, reading either, take what fits the position we already hold. The incentive produces the shortcut, and the shortcut is usually harmless. It costs you when the system underneath has changed and the headline hasn’t.
Same number, different system
So I put the two quarters side by side, using Stats NZ’s current series on my labour dashboard.
One thing to declare first. The 5.7% for September 2015 is the number as it stands now. The figure published that November was 6.0%.2 Stats NZ rebuilt the survey in 2016 and carried the change back through the earlier years, so nobody reading the news at the time saw 5.7%. The rebuild alone took it to 5.5%; seasonal adjustment, rerun each quarter since, has lifted it to 5.7%. Before adjustment, September 2015 and September 2026 both read 5.5%. The number I recognise only exists in the series as it was rebuilt, which is one more thing the comparison carries without telling you.
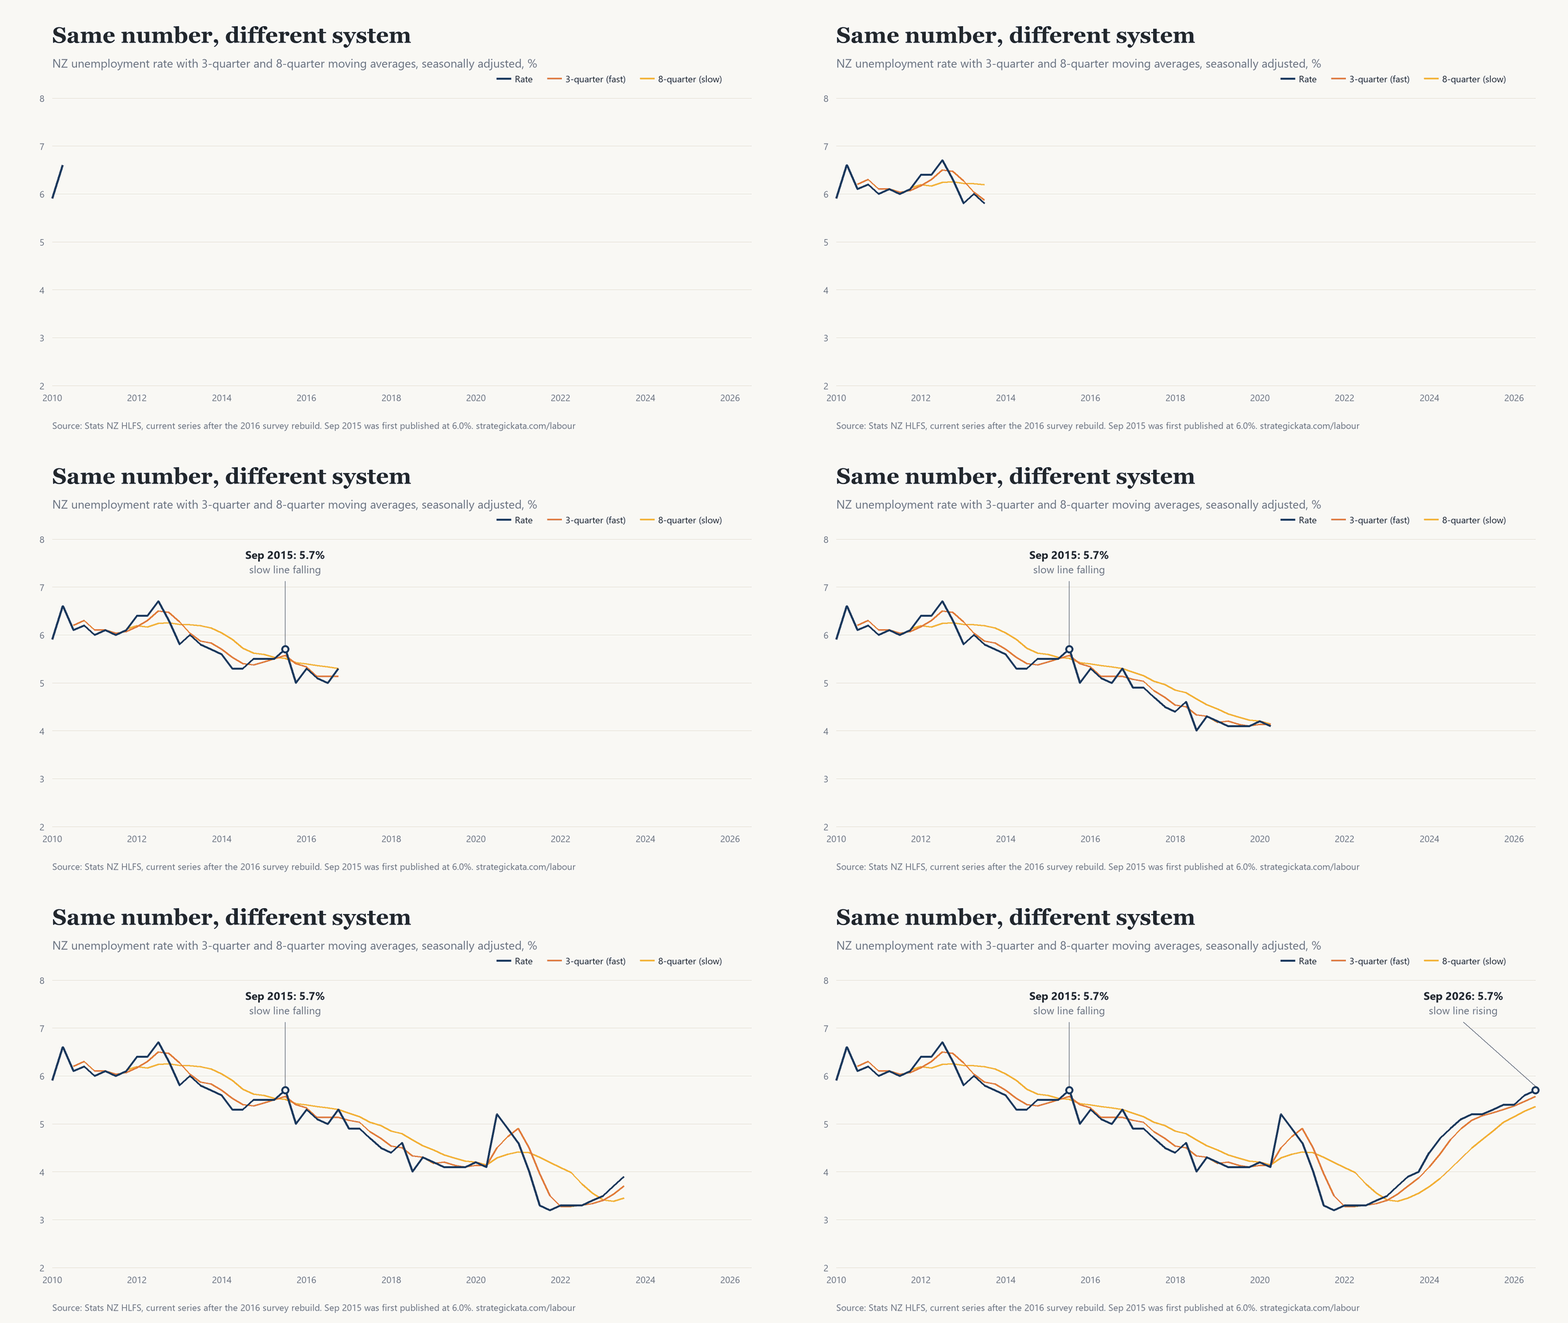
The headline matches: 5.7% in both. The 3-quarter moving average matches to two decimal places, 5.57 in both. Underutilisation is within a tenth, 13.7% then and 13.8% now. Stop at the fast numbers and you would call it 2015 again.
The 8-quarter average is where the two quarters part. In September 2015 it had been falling for two and a half years, from 6.22 in March 2013 down to 5.51, and the 5.7% was the fast line poking up through a slow line still on its way down. A quarter later the rate was back under it. Today the slow line has been rising since the middle of 2023, from 3.38 to 5.36, and the fast line has sat above it for 14 straight quarters without once crossing back. The employment rate reads the same way from the other side: 64.5% in September 2015 and about to climb to 68% over the next two years, 66.4% now and down from 69.7% in 2023. In August I wrote that both of the 2015 averages were flat. Looking at it again, the slow one was falling, which makes the gap between the two years wider than I said.
I learned to read a fast line against a slow one doing technical analysis on my own investments and savings, all of it in Excel spreadsheets. It started as a hobby, because I wanted to understand how trends move and what moves them. The statistics from a Lean Six Sigma course filled in some of it, and in 2012 I took Model Thinking, the University of Michigan course on Coursera, which gave me Markov processes, probability and Bayes’ theorem, ways of explaining why things move the way they do and how likely the next move is. Three quarters is the shortest run I’ll call a trend. Eight is roughly two years, a full hiring cycle. Between them, the two lines describe how the unemployment chart moves.
What sits behind the number
The unemployment rate measures what’s happening to work, and no single lever moves it. Economics drawn as two variables on a chart, supply and demand with everything else held constant, ceteris paribus, assumes people sit still while one thing changes. People react, to the incentives and motives that drive them, no two of them alike, and the number is the net of all of it. When the OCR goes up, borrowers pay more on their mortgages and savers earn more on their deposits; the same decision lands in opposite directions, and each household does something different with it.
Read as a system, the reinforcing loops behind unemployment are still running: the cost of running a business, technology taking over some of the work, migration, fiscal and monetary policy, consumer demand, and each of those has drivers of its own. A business’s margin has to cover the costs it can’t negotiate, rates, power and taxes among them, before there’s any profit to justify the risk of being in business at all. Even a non-profit has to meet its costs first. When revenue doesn’t cover cost, something has to give, fewer staff or a closed door. The balancing loops that would push back haven’t arrived yet.
The number in the room
I didn’t always watch it. I first arrived in New Zealand in October 2002 and came back in January 2003 to look for work, and the rate didn’t matter to me then. I needed a job, unemployment wasn’t an option, and you find ways. For my first 10 years here, mostly at National Bank and ANZ, I applied for other roles and other organisations, and moving was hard; through 2010 to 2012 the rate sat between 5.9% and 6.7%.
At IRD I started paying attention, and then I started seeing it in my own teams. As a people manager I’d ask myself why turnover was high, among permanent staff and most of all among the contractors who worked for me. When unemployment was high they stayed, and asked to extend their contracts with the same organisation. When it was low, it was an employee’s market, and the ones with skills that are hard to find in New Zealand knew it. The minute a contract finished they moved on, for a better rate or a more interesting gig. I saw it at IRD and again at BNZ, and I started lining it up against the rate.
At Stats NZ I watched it to read skills shortages and demand. When the rate drops, headhunters start calling you as though you’re a preferred candidate. You don’t have to apply for anything; the recruitment market comes to you and tries to pinch people from one organisation to the next. That’s a good time to move if you time it right, and it’s the time a leader has to look hard at retention. The fundamental is pay, slightly above the market average and definitely not over the top. The rest is intangible, and at Stats NZ that meant a new way of working, an environment people wanted to stay in. It takes both.
The quarter that looked like a downturn
COVID gave me the mirror image of 2015. In the September 2020 quarter the rate jumped to 5.2%, from 4.1% three months earlier, and the people it hit first were those on non-permanent terms, contractors like the ones I’d watched come and go. Matched on the number, 5.2% looked like the start of a long slide. Work had piled up while everything stopped, a backlog of projects that hadn’t been delivered, and a lot of migrant workers had gone home. When things reopened the market competed for the people who were left, and people got paid good money to do much the same work as before. The rate was down to 3.2% by the December 2021 quarter, the lowest since the series began in 1986.3
I took that lesson and applied it to myself. Towards the end of 2021 I secured a job in Hamilton with Te Wānanga o Aotearoa, as director for infrastructure, security and data management, and later took my next step to Te Pūkenga. I moved because I was confident that a low rate makes it easier to find a job and to move. So far that test has held.
Then the rate started to rise, and things changed around me. A job is never secure when unemployment is climbing, which is why I wrote about the four strategies that keep you employed in The Long Game, and some of it is beyond your control anyway. A private-sector restructure usually means revenue can’t carry the cost: there isn’t enough demand, and the business can’t keep supplying what the market isn’t buying. Mine was a government decision to disestablish Te Pūkenga. I finished up in November 2024, and by the December quarter the rate was 5.1%. When there isn’t enough revenue to carry the cost of employment, in a business or in a government, the jobs go. Finding the next one was hard, and the rate was only part of the reason. Age was the other part, and I wrote about it in The Coach Said Ageism is a Myth.
The call, and what would end it
Three months is too short for anything to turn the unemployment rate. So the call stays where I put it on LinkedIn on 4 November, the day of the release: the December quarter, out in February, comes in at 5.8% or higher, which would be the highest since 2013, back at post-GFC levels. The rate sat between 5.8% and 6.7% for more than four years then, from June 2009 to September 2013, until the market resolved itself. The call ends when the rate and the two moving averages converge or flatten out. They haven’t yet.
What would make me wrong is something like 2020: a spike against the trend, set off by a coordinated global response that changed how people behaved and stopped the economy from behaving normally. That kind of anomaly can’t be predicted. It takes enormous resources and coordination, and its unintended consequences can run for years before they resolve; some of what we’re living with now is the long shadow of decisions made then. There’s always an unknown in the 20% my model doesn’t hold, and it’s the part that proves you wrong.
The last time the rate was 5.7%, I was changing jobs. This time I’m watching the slow line.
- Stats NZ labour market statistics, September 2026 quarter, as reported by interest.co.nz, 4 November 2026, and Westpac’s first impressions, 4 November 2026. ↩︎
- RNZ, 4 November 2015. The 2016 change is set out in Stats NZ’s revisions to labour market estimates. ↩︎
- RNZ, 2 February 2022. The quarterly figures elsewhere in this piece are Stats NZ’s current seasonally adjusted series, as held on my labour dashboard, which revises earlier quarters as new data comes in. ↩︎