In 1997 I was working at ABN AMRO in Kuala Lumpur, close enough to the Treasury floor to see what it was doing, and that was when my phone started ringing. Friends I hadn’t heard from in months wanted to know what was happening, because someone at a foreign bank must surely know, and I guess they hoped I’d tell them it would all be over by the weekend. It wasn’t. Thailand had floated the baht in July and it collapsed, and within weeks the ringgit was being traded hard by speculators, sliding from around 2.50 to the US dollar to past 4.50 by January 1998. The stock market lost more than half its value by the end of 1997, and kept falling through 1998. My own savings and investments went down with everything else, and there wasn’t much I could do about it except watch.
Around me, people sold at whatever price they could get, to cut their losses. I held on, mostly because I couldn’t see what selling at the bottom would fix, and once things rebounded that turned out to be the right call. I didn’t follow the crowd, and I’ve been glad of it ever since. This is not financial advice, but this is what I did.
The government had its own explanation. George Soros and the currency speculators were blamed, loudly and often, and for a while that was the story everyone repeated. Then in September 1998 the prime minister imposed capital controls and pegged the ringgit at 3.80 to the dollar; overnight, a floating currency became a fixed one, and money that wanted to leave the country couldn’t. The economy shrank in 1998, Malaysia’s first recession in many years, and measured in US dollars it didn’t get back to its 1996 size until 2003. Indonesia had riots. South Korea, Thailand, Hong Kong, Singapore and Japan all took damage, and ordinary people across the region lost money and livelihoods for reasons nobody explained to them in a way they could follow.
Inside the bank, I saw the other side of it. Our Treasury team made the bank’s annual profit target within a week, and kept going, though senior leadership kept that quiet given how sensitive things were. I’ve told that story before, in What AI Exposes. In a crisis there are losers and there are winners, and sometimes they’re in the same building.
What stayed with me was how little of it had started in Malaysia. A devaluation in Bangkok ended up in my savings in Kuala Lumpur, and the explanation offered at home was one man’s name.
Where the loops came from
A couple of years later, one of the required readings on my MBA was Peter Senge’s The Fifth Discipline. It introduced me to systems thinking, and I’ve been hooked ever since, because it gave me words for what I’d just lived through.
Senge’s building blocks are simple enough for a 12-year-old. A reinforcing loop is a chain where more causes more: the currency falls, people sell to protect themselves, the selling pushes the currency down further, and so more people sell. A balancing loop is something that pushes back: prices rise, people buy less, and the rise slows. Most of what happens in an economy is a handful of these loops running at once, some gaining strength and some fading, and the archetypes are the patterns they keep forming, over and over, whatever the country and whatever the decade.
Read 1997 that way and the capital controls were a balancing loop built by hand, a government forcing a stop on a reinforcing loop that nothing else would break. It had an intention, and it had consequences, some intended and some not. Soros, whatever his part in it, was one link in the chain. Blaming him was a convenient place to stop thinking.
Since then it’s become a habit. When I hear a plan, I look for the loops it hasn’t accounted for, and that usually tells me whether it will work and who it will hurt on the way. Your mental model stretches further than the people around you once you start doing this, which isn’t always comfortable for them, or for me.
The fishbowl
Now I live in a small economy again. New Zealand is open to the world in every way that matters for money: we import our fuel, we borrow offshore, we sell milk powder at prices set in global auctions, and well over half of our government bonds have historically been held by foreign investors, who buy and sell them alongside their US Treasuries.
And yet when I read economic commentary in New Zealand, and especially the comments underneath it, much of it is drawn inside the border, as if the country were a fishbowl and everything that mattered were in the water. The RBNZ gets the credit or the blame for interest rates. The government gets the credit or the blame for the debt. Readers line up behind one view and stay there, anchored, and every new article confirms what they already believed.
I don’t think there’s a right or wrong opinion in this. Every opinion is built from someone’s lived experience, what they’ve observed, and their own biases, and none of us has lived everything. I fall into the same trap. I’ve caught myself arguing a point hard with someone who simply didn’t have the information I had, and in What I Kept and What I Only Thought I Valued I wrote down the question I’ve learned to ask instead: what is your lived experience that I have not lived, that makes you believe what you do? The answer tells me where the gaps are, theirs and mine, and whether to help fill them or let them be. It’s not easy to take on an alternative view of something you haven’t lived through, observed, learned or read about.
1997 is my lived experience that most New Zealanders haven’t had. It’s why I get uneasy when an analysis stops at the border.
Here’s what stopping at the border misses right now. The RBNZ steers the short end of the interest rate curve, and that matters, because most New Zealand mortgages fix for one or two years and price off short-term swap rates the Reserve Bank does influence. The long end is another matter. Forsyth Barr puts the correlation between New Zealand and US 10-year government bond yields at around 80% over the past 20 years. You can see it working this year: between 1 July and 13 October, New Zealand’s 10-year yield took about 70% of the rise in the US 10-year. That came in through the offshore bondholders, without anyone in Wellington deciding it, and it flows into the government’s borrowing costs and from there into every party’s debt track.
Petrol shows the same thing at the pump. On 13 October, 91 octane averaged NZ$3.61 a litre, up nearly 14% in four weeks, on tanker attacks and supply fears half a world away and a New Zealand dollar sitting near the bottom of its two-year range. And there are costs the model doesn’t even try to hold: earthquakes, floods and extreme weather get priced into global reinsurance, and that comes back to us as higher premiums. Ignore them, exclude them, hide them, they still get imported into the economy as a whole.
Follow the money, people say. Behind every flow of money there’s an intention, mostly greed or fear, and behind every intention a consequence nobody fully planned. We’re in the 21st century and human nature hasn’t moved much: everyone wants more resources and fears losing what they have. When a country prospers, its people get on with life. When it doesn’t, you get friction, and in 1997 I saw how quickly that turns ugly.
Not a Fishbowl
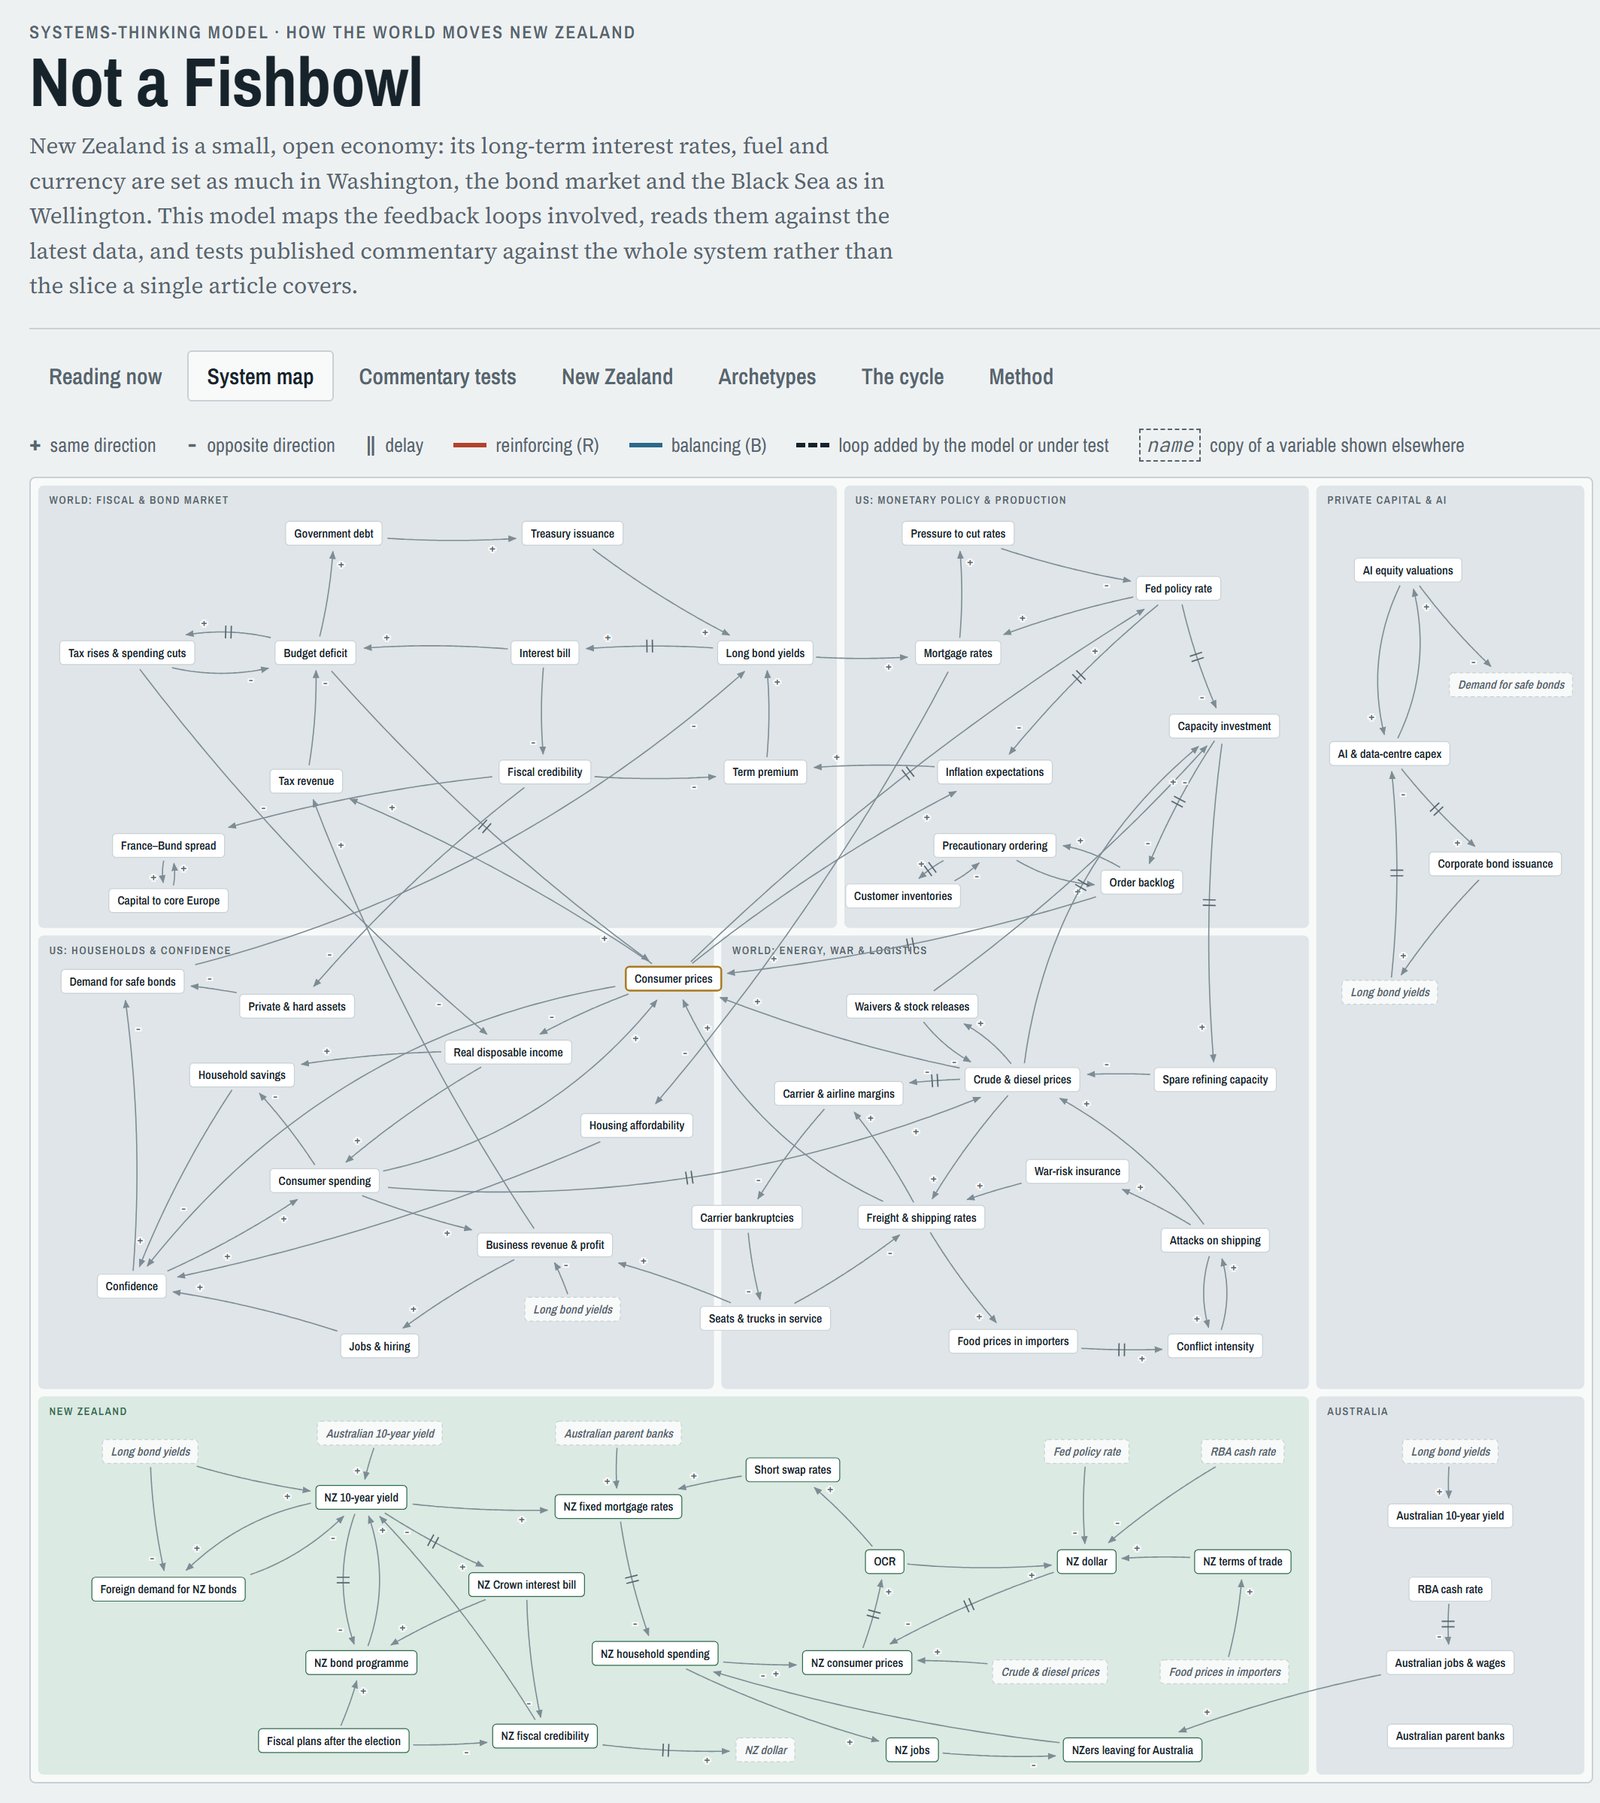
So I built a model. It started for my own use, and it’s now a page on this site: Not a Fishbowl, at strategickata.com/systems. It maps how the world economy moves New Zealand through 34 reinforcing and balancing loops, across seven sectors: world bond markets, US monetary policy, US households, energy and war, private capital and AI spending, Australia, and New Zealand itself. Australia is the second channel after the US: its bond market, its central bank, the parent banks behind most New Zealand lending, and the jobs that draw New Zealanders across the Tasman. Live data drives each loop’s status, gaining, mixed, steady or fading, and where I don’t yet have an indicator for a loop, the page says “no indicator” and leaves it there.
The part I care most about is the test log. When a piece of economic commentary is published, I run it through the model and ask the same questions every time. Which loops does it use? Which relevant loops does it leave out, and why do they matter? Does it rely on anything the model doesn’t hold? Does it stop at New Zealand’s border? What does it predict, even if only implicitly, and which indicator will show whether that holds? Each test gets a review date, and when the date comes it gets scored: held, partly, failed, or void if the event it depended on never happened. Nothing is deleted. The scorecard, misses included, is the record. A test judges the scope of the argument and the loops it covers, and leaves the author’s motive alone.
The first commentary I tested was my own. I’d written a note on how US Treasury yields reach New Zealand, and I was confident in it. Run against the model, it came back partial. The long end of our rates is imported, as I’d said, but I’d written nothing about the short end, where most New Zealand mortgages price and where the RBNZ has real control. That’s the kind of blind spot I built it to find, and it found mine first.
The first test on the live page is Roger J Kerr’s five indicators for the New Zealand dollar, from interest.co.nz. It’s there because its scope is system-wide: it crosses the border through US rates, AI borrowing, oil, and elections in both countries. Even so, the model found loops it didn’t use, including the offshore holders of NZ bonds who carry US moves into our rates.
The page also carries an example of each of the other two scopes, so you can see the difference. David Skilling’s case that higher rates are a structural reset is partial: the argument is global, the data largely backs it, and it stops where the New Zealand question starts. Brian Easton’s check of the government’s fiscal record against Treasury’s 2023 forecast is narrow: careful on Treasury’s own numbers, but it measures debt as a share of GDP and leaves out the interest bill, which is the part that’s moving, mostly on rates set offshore.
What you won’t see on the page are the party plans. During this election campaign I tested the fiscal and tax plans of every party that had published one, with the same template for all of them. Every one stopped at the border. They argued about Crown debt and the credibility premium New Zealand pays to borrow; as reported, none said what interest rates its debt track assumes, and all treated global shocks as something that might happen in future, when the cost is already flowing in through the bond market. That’s fishbowl analysis, from every side. I keep those as working notes for myself.
Gold, then and now
One loop in the model is my own hypothesis, and it’s under test like everything else. By the end of the Second World War, the United States held about two-thirds of the world’s monetary gold outside the Soviet bloc. Through both wars, money looking for safety went to America and into US government bonds, the quality asset of the day. Economists call it a flight to quality.
I see similar triggers now, with a different destination. Money looking for safety seems to be moving away from government paper altogether and into private assets: shares, buildings, collectibles, corporate bonds, and gold, which was over US$4,100 an ounce on 13 October. If I’m right, that loop shows up in the data as gaining. If I’m wrong, the model will say so, and I’d rather find out there.
The next four weeks
The timing is a good test. Stats NZ publishes the September quarter CPI on 22 October. The RBNZ reviews the OCR on 28 October. The US midterms are on 3 November, the September quarter unemployment figures come out on 4 November, and New Zealand votes on 7 November. After that comes the new government’s fiscal plan, and Budget 2027, whoever wins.
I’ll keep feeding the model commentary as these land, from New Zealand, the US and further afield. The readings are refreshed every week, so you can come back and see what moved, which tests held and which failed. If it turns out to be useful to someone besides me, maybe it becomes a small public service one day. For now it’s a sense-maker for me, and it will get better as more data goes in and more connections show up.
I know there will never be a perfect model. If I can get 80 to 90% of the understanding of a situation by putting commentary through it, I think half the battle is won, maybe two-thirds of it. Whether any reading plays out depends on action or inaction, more often inaction, and even inaction here can be set off by decisions made somewhere else.
1997 taught me a few things I still use. Don’t follow the crowd. Set your own goals and targets. Don’t be greedy. There’s always a root cause behind market behaviour and its triggers, and it’s rarely inside one border. The more I read, the more I learn about how economics behaves in practice, and most of that I didn’t learn at university.
New Zealand is not a fishbowl. Neither was Malaysia in 1997.